
This is what your venues look like in Forq
Real product screenshots with sample data — no mock-ups. If you'd rather click around a live version with data like yours, leave your details and we'll be in touch — or try the interactive demo.
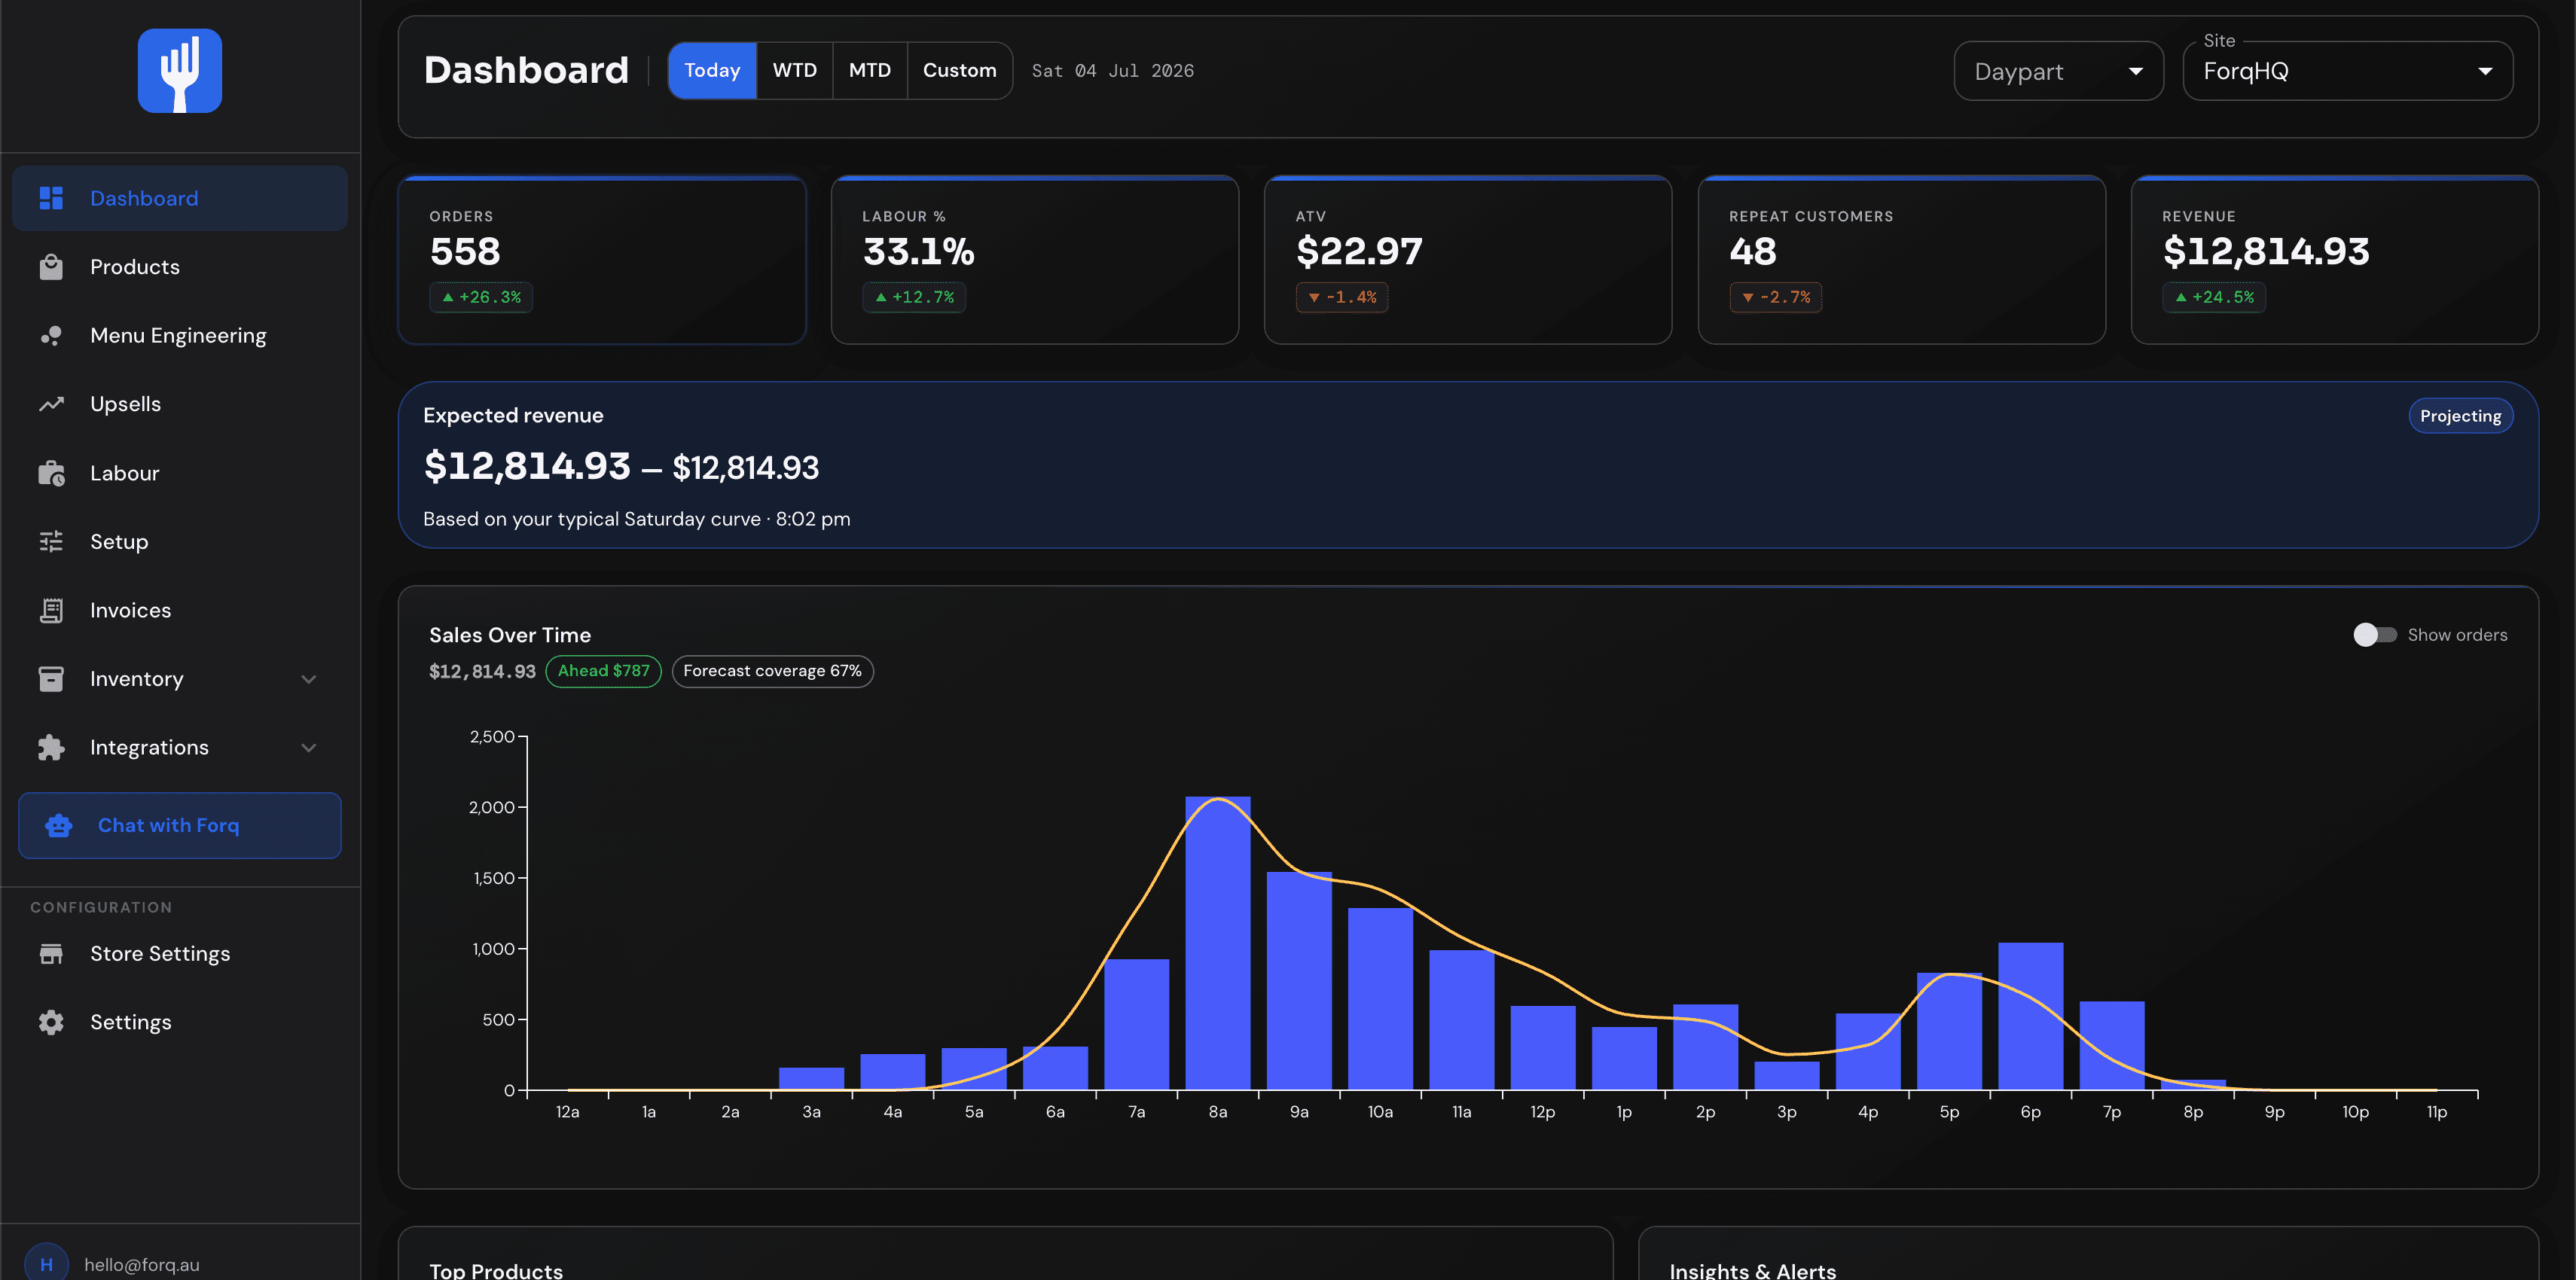
The live dashboard
Revenue, orders, average ticket, and labour percentage across every venue — updated as orders land, not at end of day. This is the screen operators check with their first coffee.
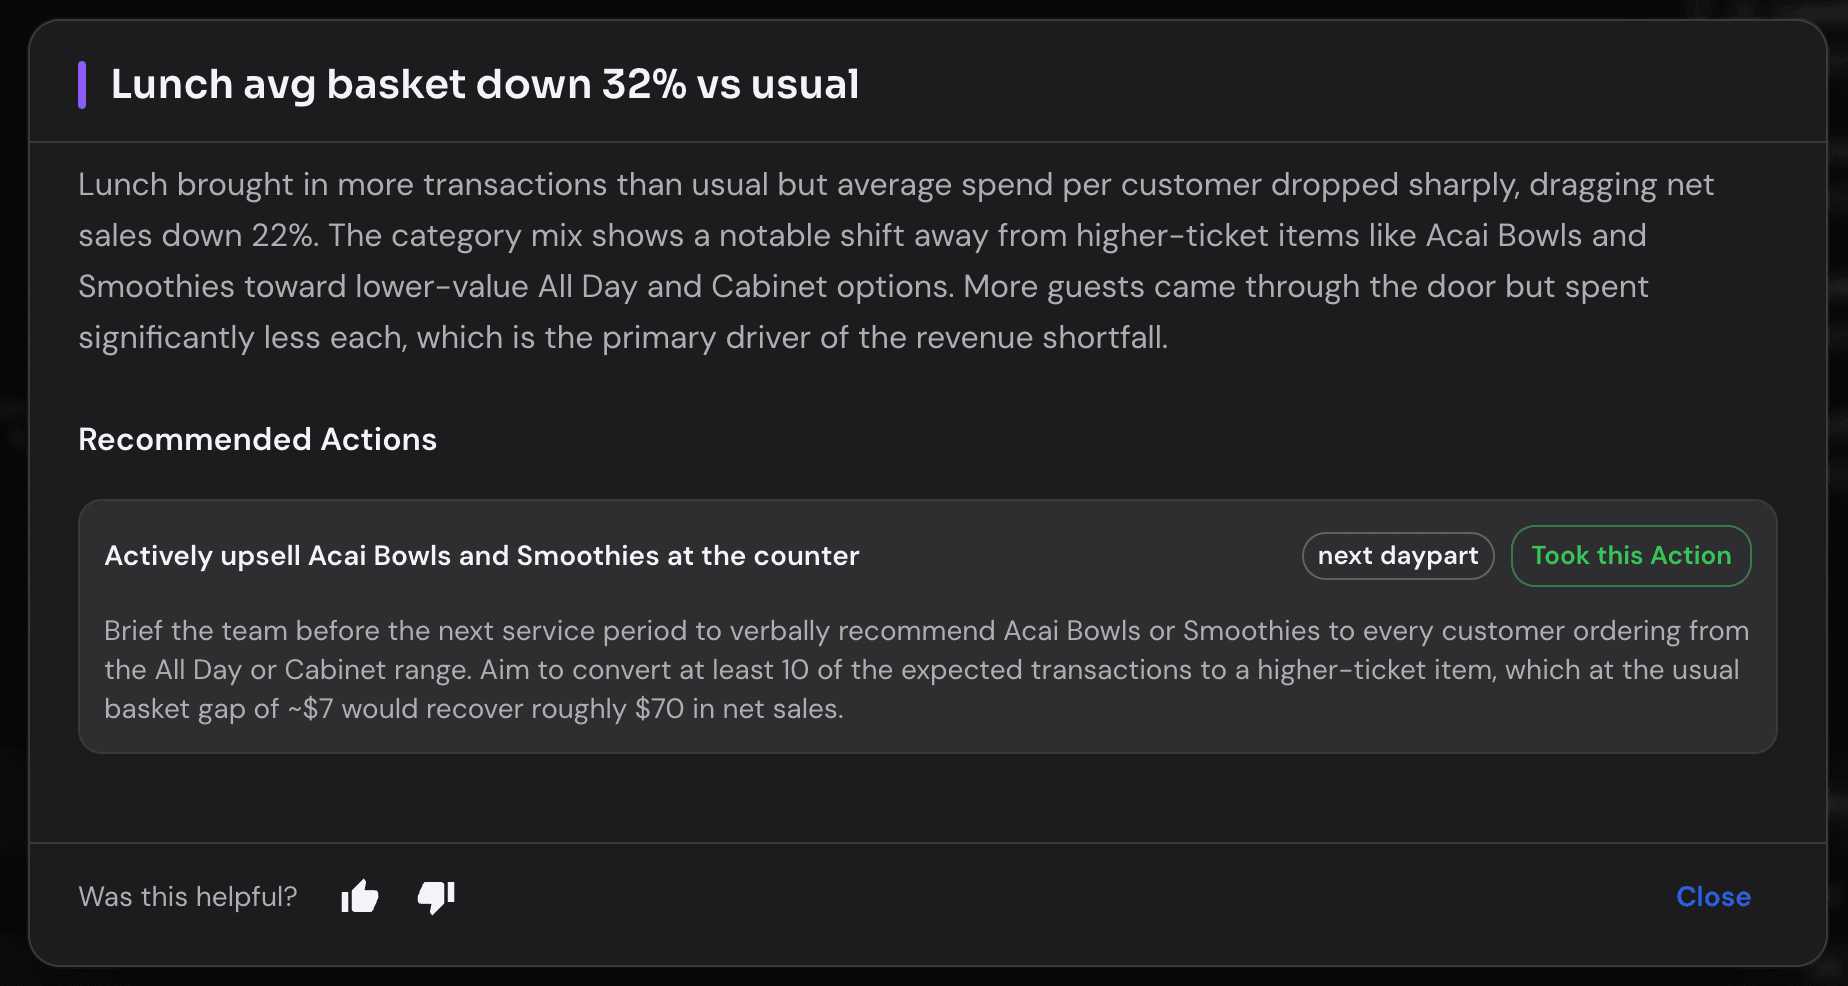
AI insight cards
Forq reads your data so you don't have to read every report. Insights call out what changed, why it matters, and what to do about it — like a virtual ops manager.
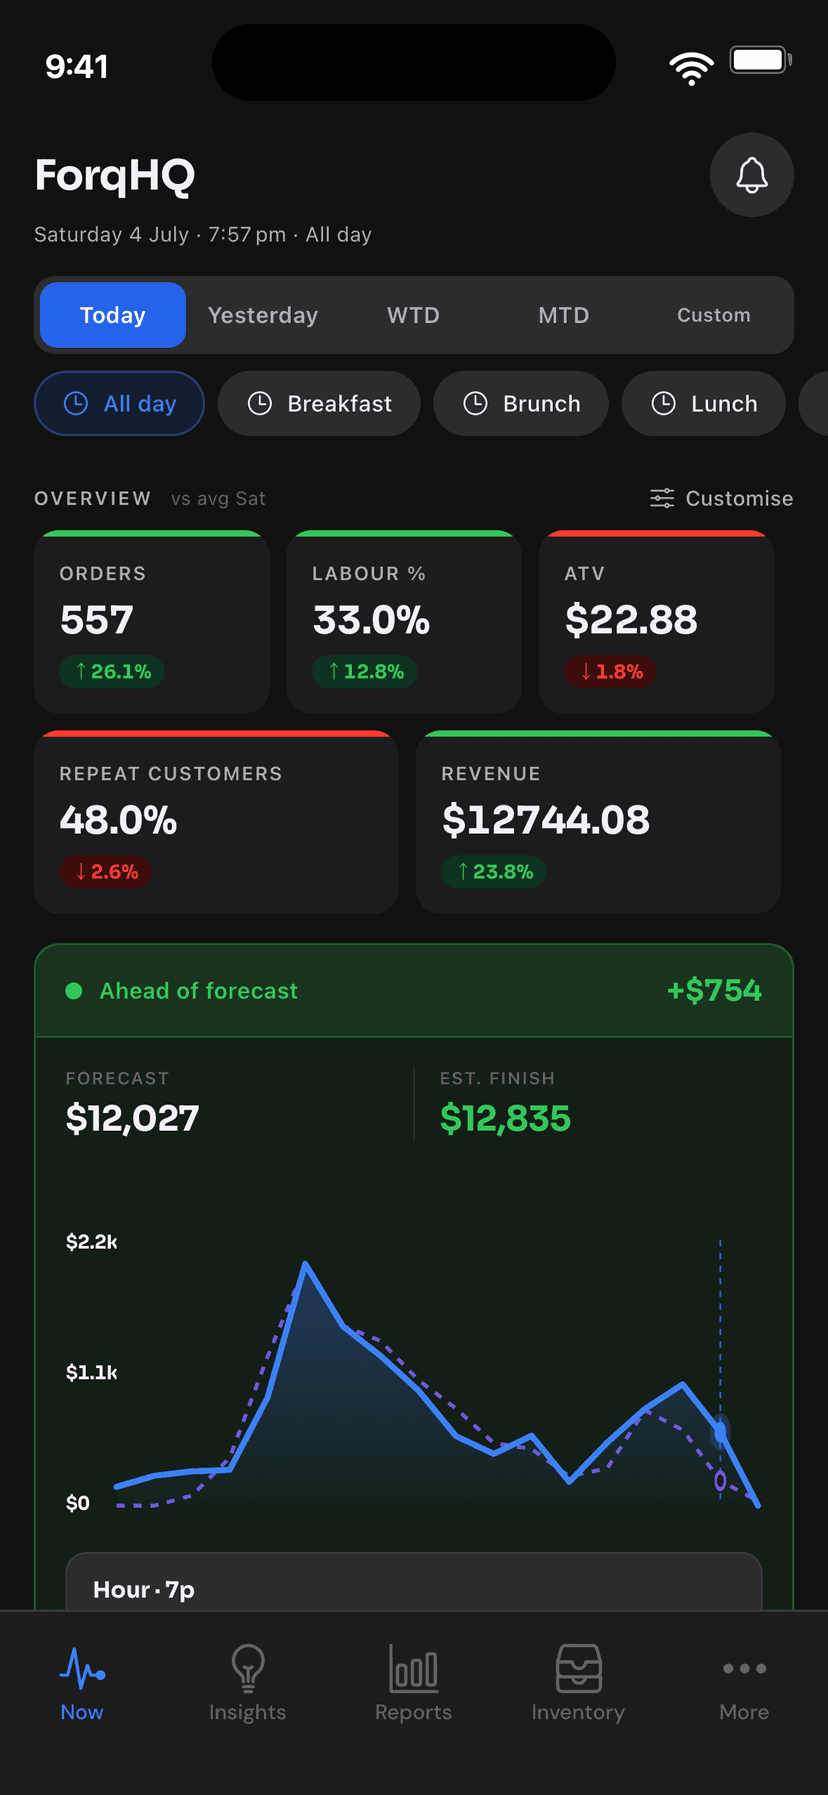
Mobile dashboard
The same live numbers in your pocket. Sales over time, KPIs, and venue switching designed for a quick check between services.
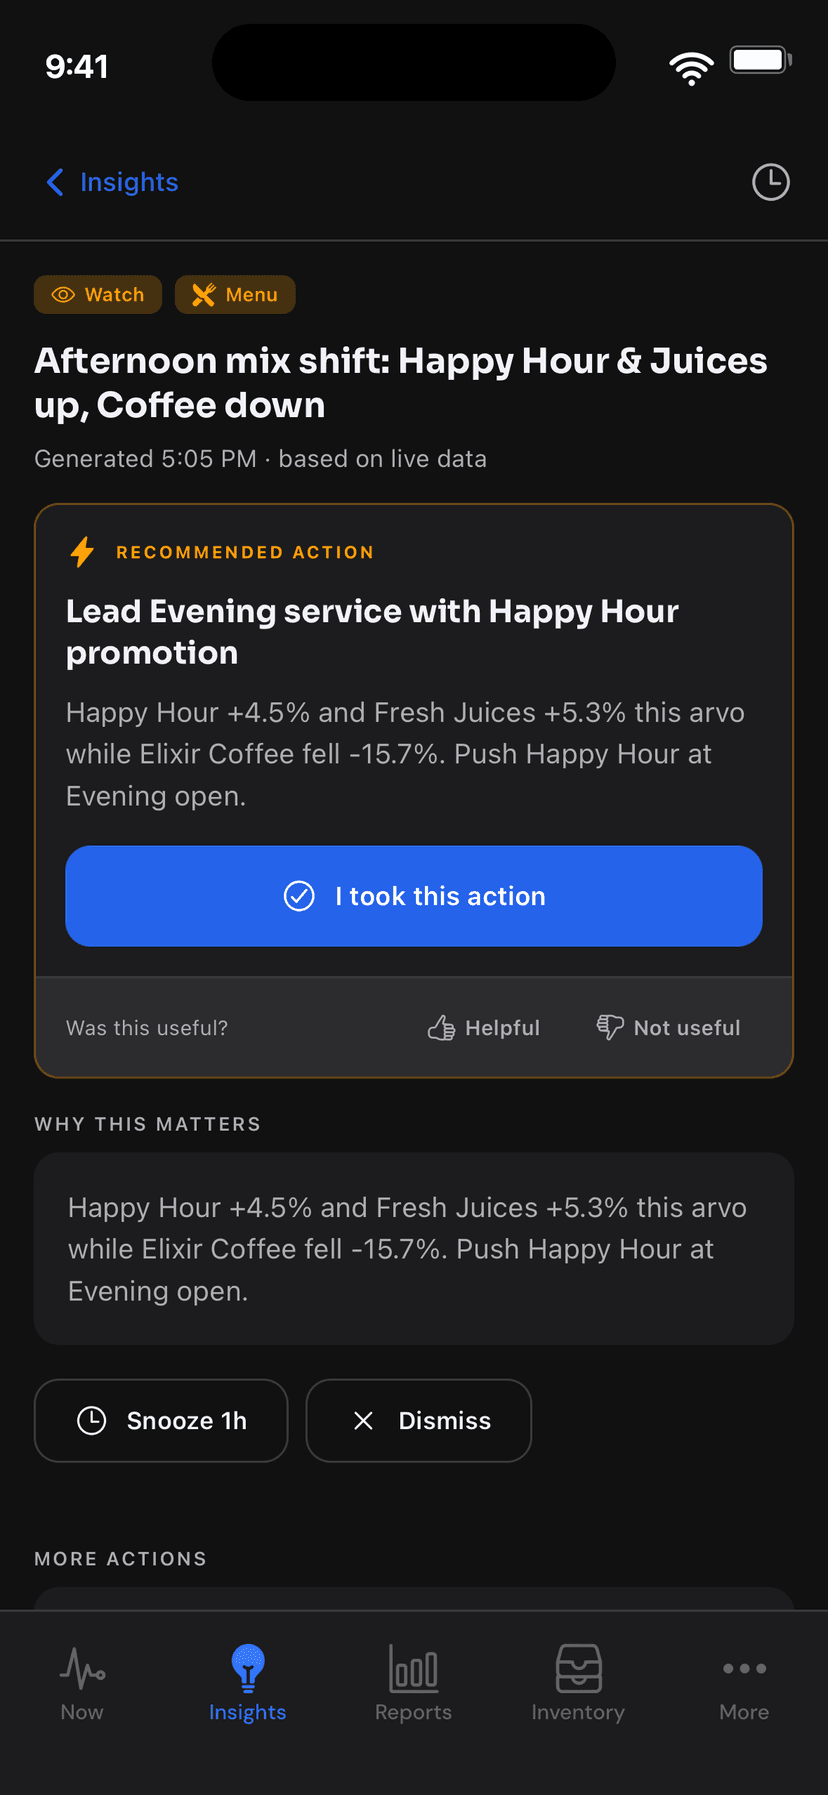
Push notifications
When labour runs hot or sales spike, Forq tells you — you don't have to go looking.
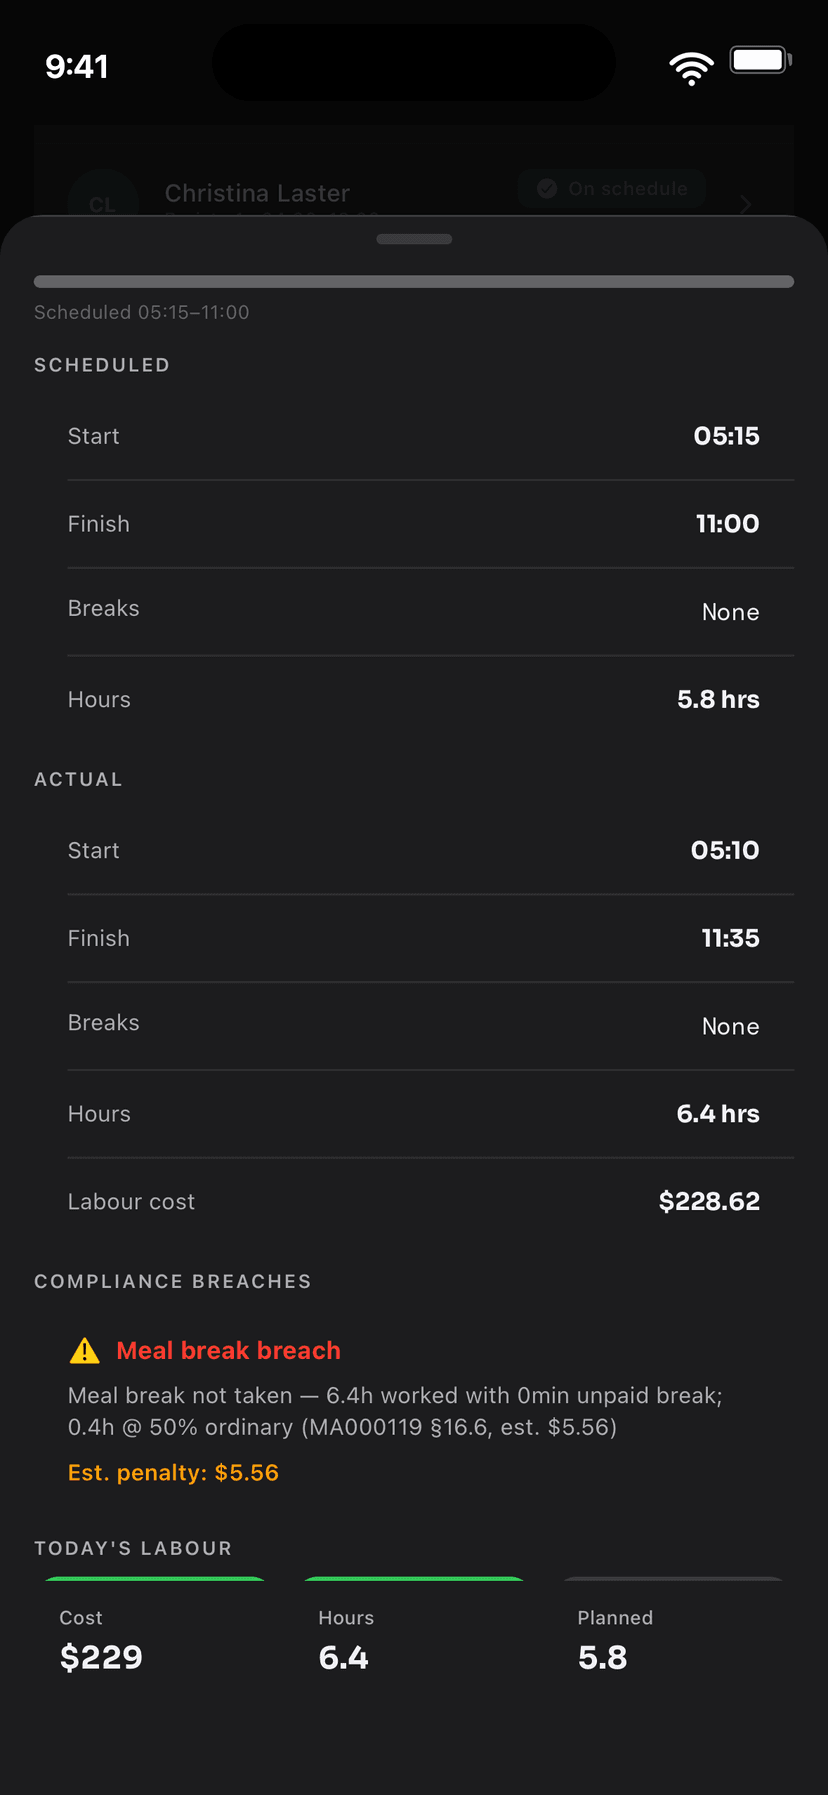
Labour alerts
We alert you to potential overtime risks and flag when labour is bleeding profit — so you can act during the shift, not after payroll.
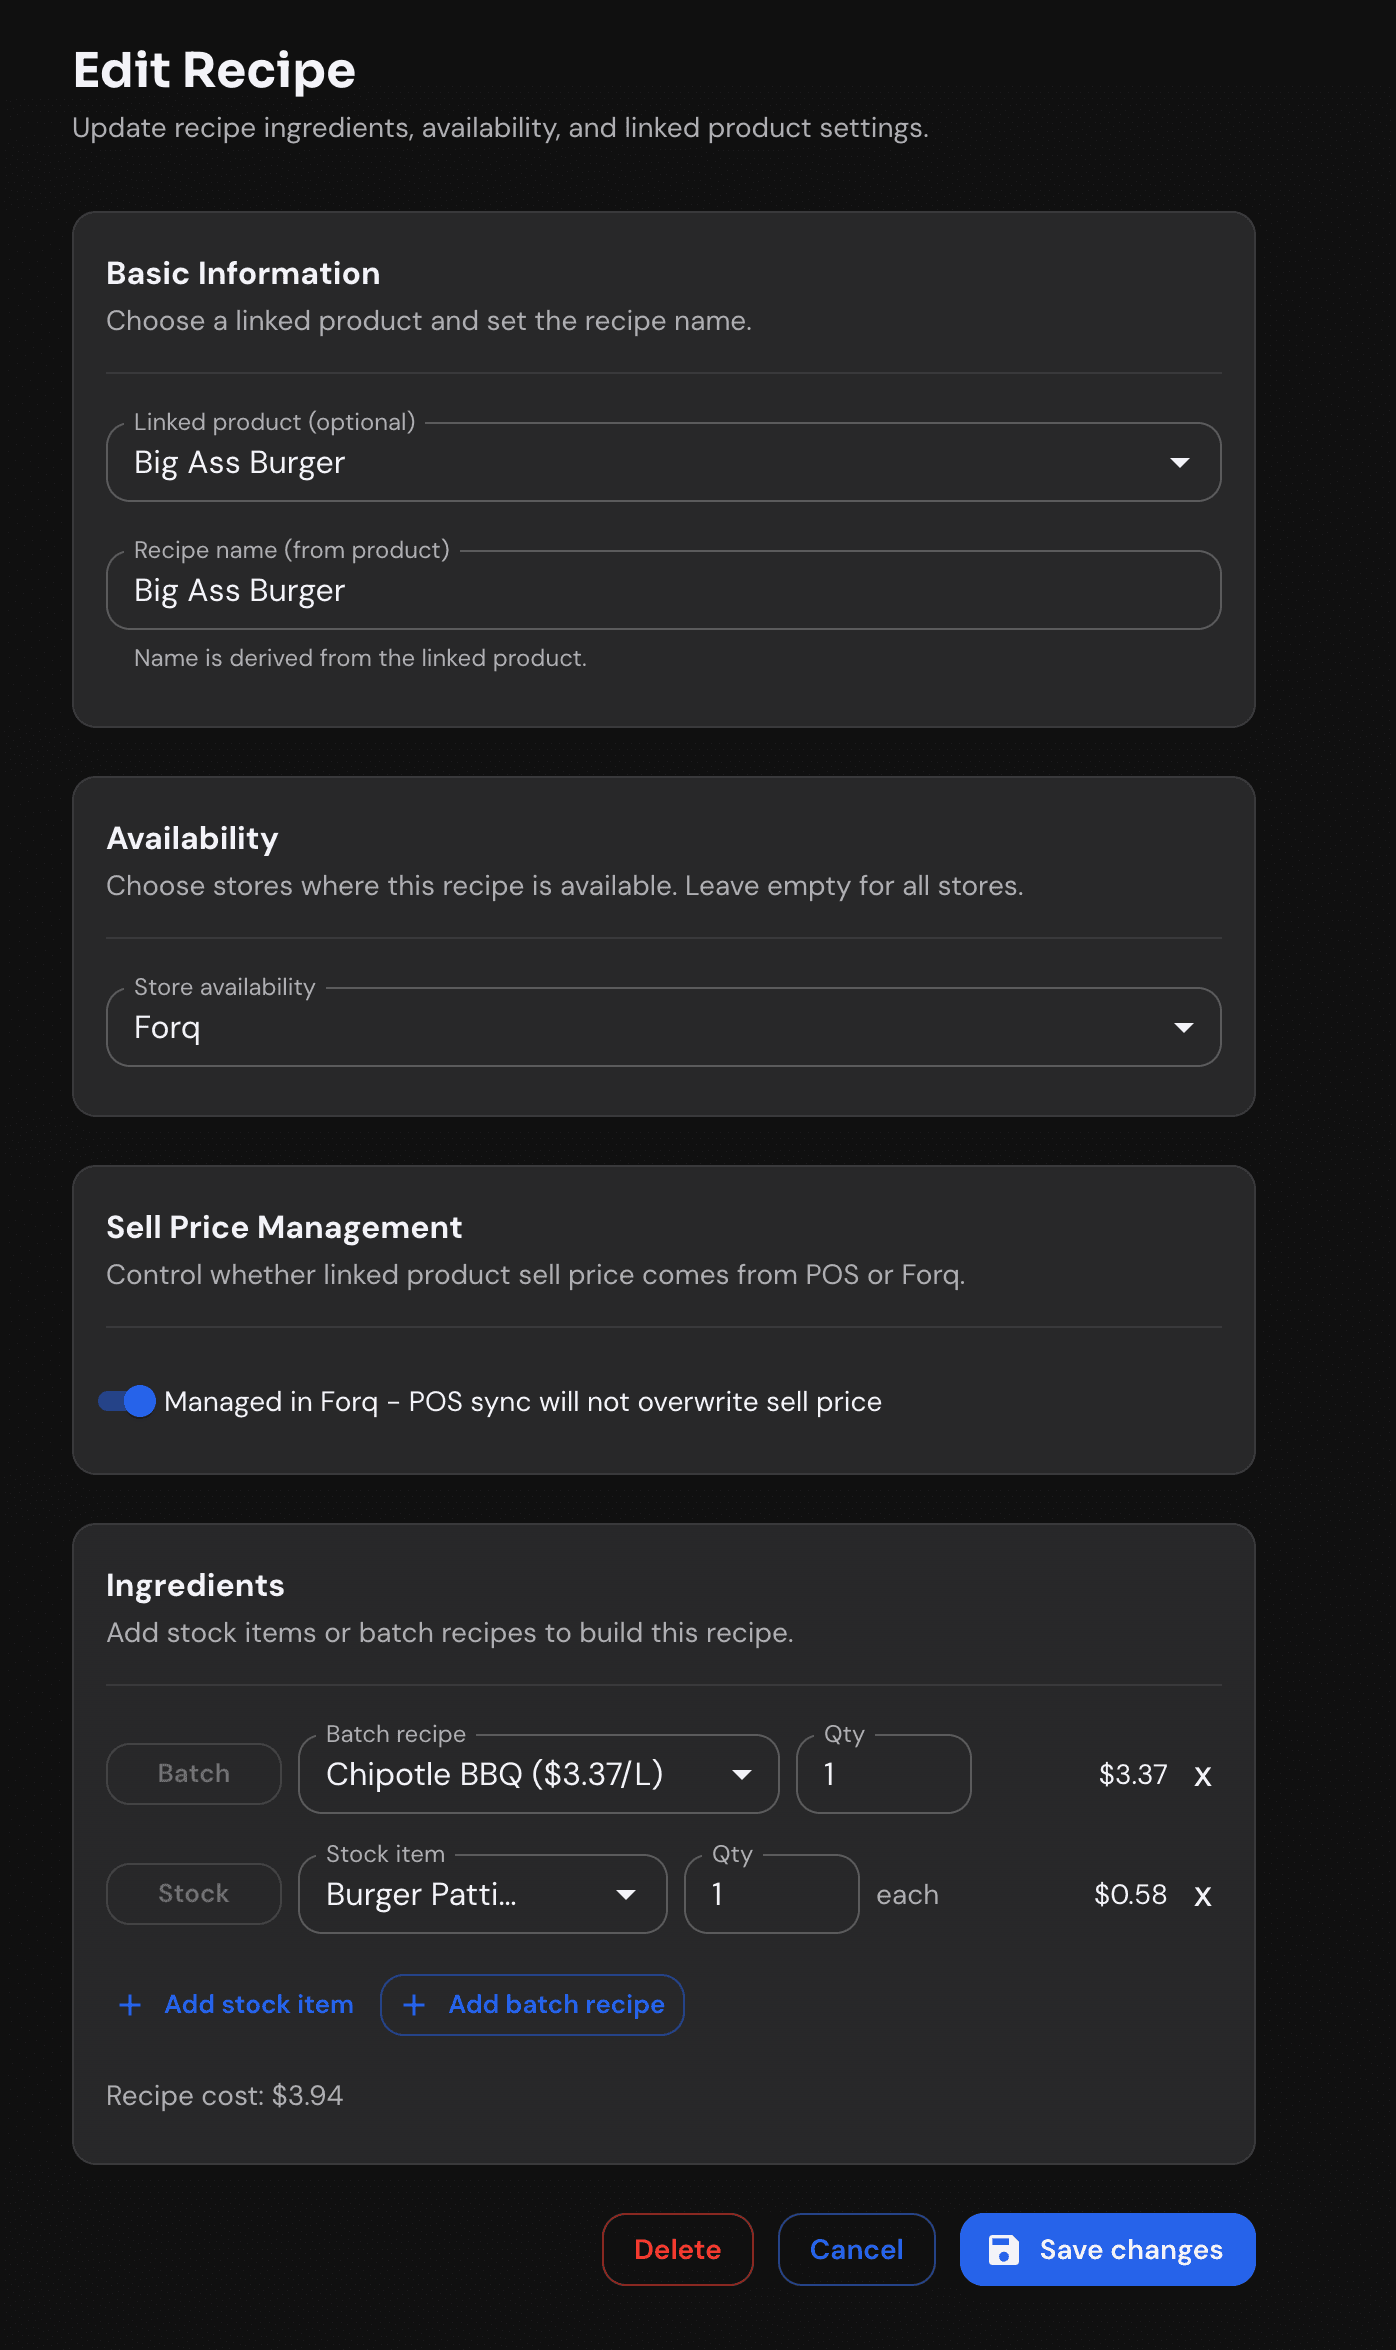
Recipes & inventory (add-on)
For venues on the Inventory Management add-on: recipes with components and yields, batch production, stocktakes, and purchasing — all tied back to margin.
Want to see it with your data?
Leave your details and we'll be in touch, or email any questions to hello@forq.au.
Questions? hello@forq.au